The Client
Public Sector Restructuring and Internal Audit Board - RIAB, executes State Owned Enterprise Reform Initiatives. It has worked in association with National and International Agencies such as Commonwealth Secretariat, Commonwealth Association for Corporate Governance, OECD, Global Corporate Governance Forum, UNDP and the Academy of Corporate Governance. RIAB also carries out macro level fund management and monitoring and performance management of State Owned Enterprises.
The Business Challenges
RIAB was managing the monthly reports of quite a number of State Owned Enterprises through Excel and this was a tedious task for the employees as well as very difficult to manage. They needed an automated system which would make this work much easier. Generating different types of reports to find out the financial state of the public sector unit was their primary requirement. They needed an insight into profit making and loss incurring units. They also needed reports based on various criteria. One of the main challenges we faced was that they needed the data exported in the same format as they were currently using. The template excel they provided had a lot of formatting. The reports which are submitted to the system also needed different levels of approvals from the enterprises side as well as under RIAB.
The Business Requirement
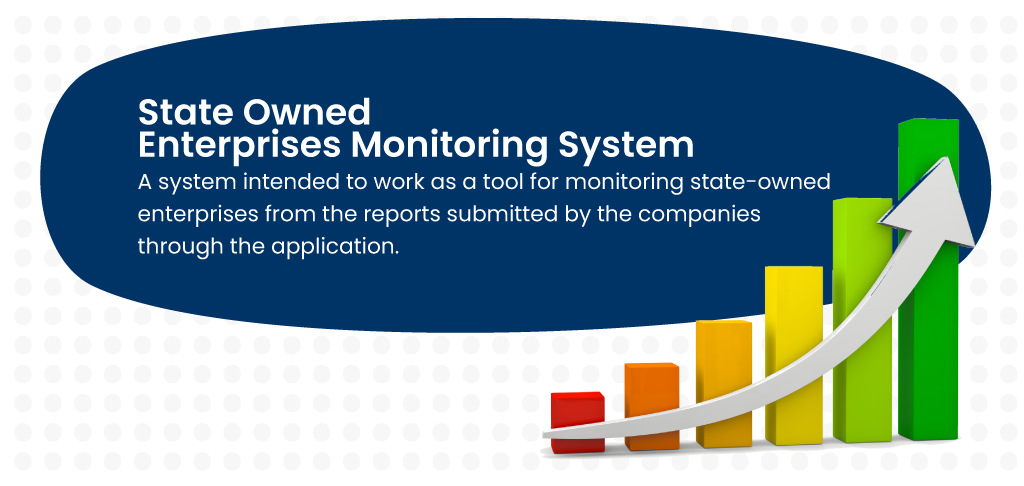
They needed a system intended to work as a tool for monitoring state-owned enterprises (SOE) from the reports submitted by the companies through the application. The system intended to provide RIAB, various reports required by them from time to time. The system should be designed foreseeing such requirements of various reports, and it is designed in such a way that a new report when requested by RIAB, shall be generated with least time and effort. So basically the report collection from SOEs , monitoring the parameters and analysis and generation of other reports should be done by the new system.
The Solution
A web application which will help state-owned enterprises to submit their monthly report online and the RIAB staff verify details as well as generate reports.Primarily the application may be having the following type of users
- RIAB Administrator
- RIAB Director
- Companies MD
- Companies Staff
1. Dashboard
This was supposed to have a consolidated view of the data received from Monthly reports submitted by the companies in the form of widgets and graphical representations.

Companies Turned Operating Loss Recently
_1590670693.png)
Companies Whose Sundry Debtors Increased By 10% When Compared To Last Month
_1590670718.png)
2. User Management Module
This module enables CRUD (Create, Read, Update, Delete) functions to be applied on user’s. The created users can login to the system with the credentials.The users can be created with different types of roles. Each role is given specific permissions and the view would be different accordingly.
3. Company management module
CRUD functions can be applied to the state owned enterprises (Companies) according to the permissions given to the roles of the users.
4. Product module
Every company would have a set of products they make. This module gives the CRUD functionalities for products according to permission of roles.These products are used in other parts of the project.
5. Budget management module
This was one of the most important aspects of the project. Every company was provided with a budget and related matrices. The companies created the budget for an year which needed to be approved by RIAB. Only after this process companies will be able to submit monthly reports.
6. Monthly Reports Module
This part is the backbone of the project. Every company needs to submit a report of their income - expenditure data with lots of inputs for each month. Many of the inputs we calculated from previous month values.Some of the values are prefilled from the Budget data submitted . The monthly report needs to be created by a company staff and needs to be approved by Company MD. RIAB staff will go through and verify and Approve.There was a download as Excel feature in the same format as the currently used Excel.
7. Reports Module
This was the feature they were expecting to be the best feature of the application. The main one was the performance report which gave them an insight into yearly performance of all companies. They also needed a lot of other reports depending on various parameters.
8. Settings
This would include profile settings, password changes etc.
Benefits
The upsides of the application is definitely easier management of data.The main benefits offered are
Enterprises & RIAB can manage data for any timeframe starting from the time of deployment of the application
Monthly reminders are sent to the respective enterprises before and on the date of submissions which makes the system more efficient
All changes made to the data are noted as history making it easier to track
Custom report feature help the client create reports with flexibility in the data they want to generate
Permission management was implemented everywhere so that adding new user roles with specific permissions was made very easy
Charts and graphs create a quick overview of the present condition of the system
Technical Overview
The project was decided to be developed in Laravel ( PHP framework ) with a database in MySQL.
Why Laravel?
- MVC Support and Object-Oriented Approach
- Built-In Authentication and Authorization
- Packaging System which helps in plug and play features
- Command line interface called as Artisan
- The Eloquent ORM
- Templating engine
Two environments namely develop and test were set up and when a feature was stable in develop and tested ok by tester’s it was to test. It was then reviewed by the point of contact at the client side. Agile methodology was followed throughout the development so that feedback was received from clients at each phase. Jobs were set up in Jenkins to facilitate continuous integration. Git was used for version control to monitor different stages of the application.Proper documentation was done about the requirements and a user manual was provided to the client complete with video reference for each feature.
The Results
Once the project was completed it saved a lot of time for the client and the management of data became a lot easier.There were a lot of features added, on the go in the project.
- 1. Turnover module - This was added on after it was found that this was something that could be reused once added.
- 2. Switch Company Option - When there are subunits of a company and the logged in user is a staff of the main company , the user would be able to switch between the companies and handle all the functionalities without going into trouble of logging in and out of the system.
- 3. Reminder emails - It was a tedious process to remind each company who has not submitted monthly reports . We set up a functionality which would take care of that. Reminder mails would be sent to companies as well RIAB will be indicated if any company has not submitted a report after the due date.
- 4. Financial year configuration - Financial year format needed for the application could be configured through this interface. This was done taking into consideration financial year from and to months could change.
- 5. Company category configuration - The categories under which the companies come can be configured through this interface.
- 6. Product Unit configuration - Different types of Products have different types of metrics. This can be configured here and reused across the application.
- 7. Assigning companies to RIAB staff - This was also a requirement that came up along development. They needed to assign companies to RIAB staff who were assigned to take care of them. As our architecture was good this did not turn out to be such a big change.
Features
- Export as excel option for all important data
- Permission management which enables smooth integration of new Roles
- Email reminders and In app Notifications which helps in timely actions to be taken.
- System configurations - All reusable settings and data can be created and reused.
- Agile development which helped in timely feedback from client
- Custom reports can be created according to data needed.
- Charts & Graphs with drill down reports for overview
Technologies and Tools Used
- Language: PHP 7.2
- Database: MySQL - 4.8.4
- Framework: Laravel 5.8.26
- Others
- Javascript
- Jquery
- CSS
- Bootstrap
- IDE: Netbeans 11
- Ticket Tracking: YouTrack
- Version Control: BitBucket
- Repository: Git
- Wireframe: Draw.io, Mind map
- Continuous integration Tool: Jenkins


